
Commercial transport electrification is no longer just a green trend; it is a strategic financial decision. But how does it truly impact your fleet's Total Cost of Ownership (TCO)?
In the current European logistics landscape, the traditional diesel model has been upended. While diesel offers low acquisition costs, it generates constant liabilities through fuel volatility and maintenance. In contrast, the electric fleet model operates as a fixed-cost instrument with clear operational advantages.

Fleet CapEx vs OpEx: Comparing Diesel and Electric Cost Structures
Analysis of current market data indicates that while the acquisition cost of electric assets remains significantly higher than diesel equivalents (often 3x to 4x for heavy-duty buses or trucks), the operational cost structure offers a competitive advantage that compounds over time.
Diesel Architecture
Low CapEx / High OpEx. Operating expenses (Fuel + Maintenance) typically account for 60% to 80% of the total lifecycle cost. This leaves most of the budget exposed to external market fluctuations.
Electric Architecture
High CapEx / Low OpEx. The battery represents a pre-payment of fuel. Energy costs typically drop to represent a significantly smaller portion of the TCO, shifting the financial weight to the balance sheet rather than the P&L.
Operational Savings (OpEx): Maintenance and Cost Per Kilometre
Energy Arbitrage
Electric drivetrains operate at substantially lower costs per kilometre due to higher thermodynamic efficiency. Current benchmarks indicate an average cost of €0.11/km for electric vans versus €0.15/km for diesel equivalents. For high-mileage fleets, this €0.04 differential generates thousands in annual savings per unit.
Maintenance Deflation
An electric drivetrain has approximately 1% of the moving parts of a diesel engine. The elimination of complex exhaust treatment systems (AdBlue, DPF, EGR valves) and the reduction of thermal stress results in a structural 30% to 33% reduction in maintenance costs for Battery Electric Trucks (BETs) and e-LCVs.
Cumulative Cash Flow & Break-Even Analysis
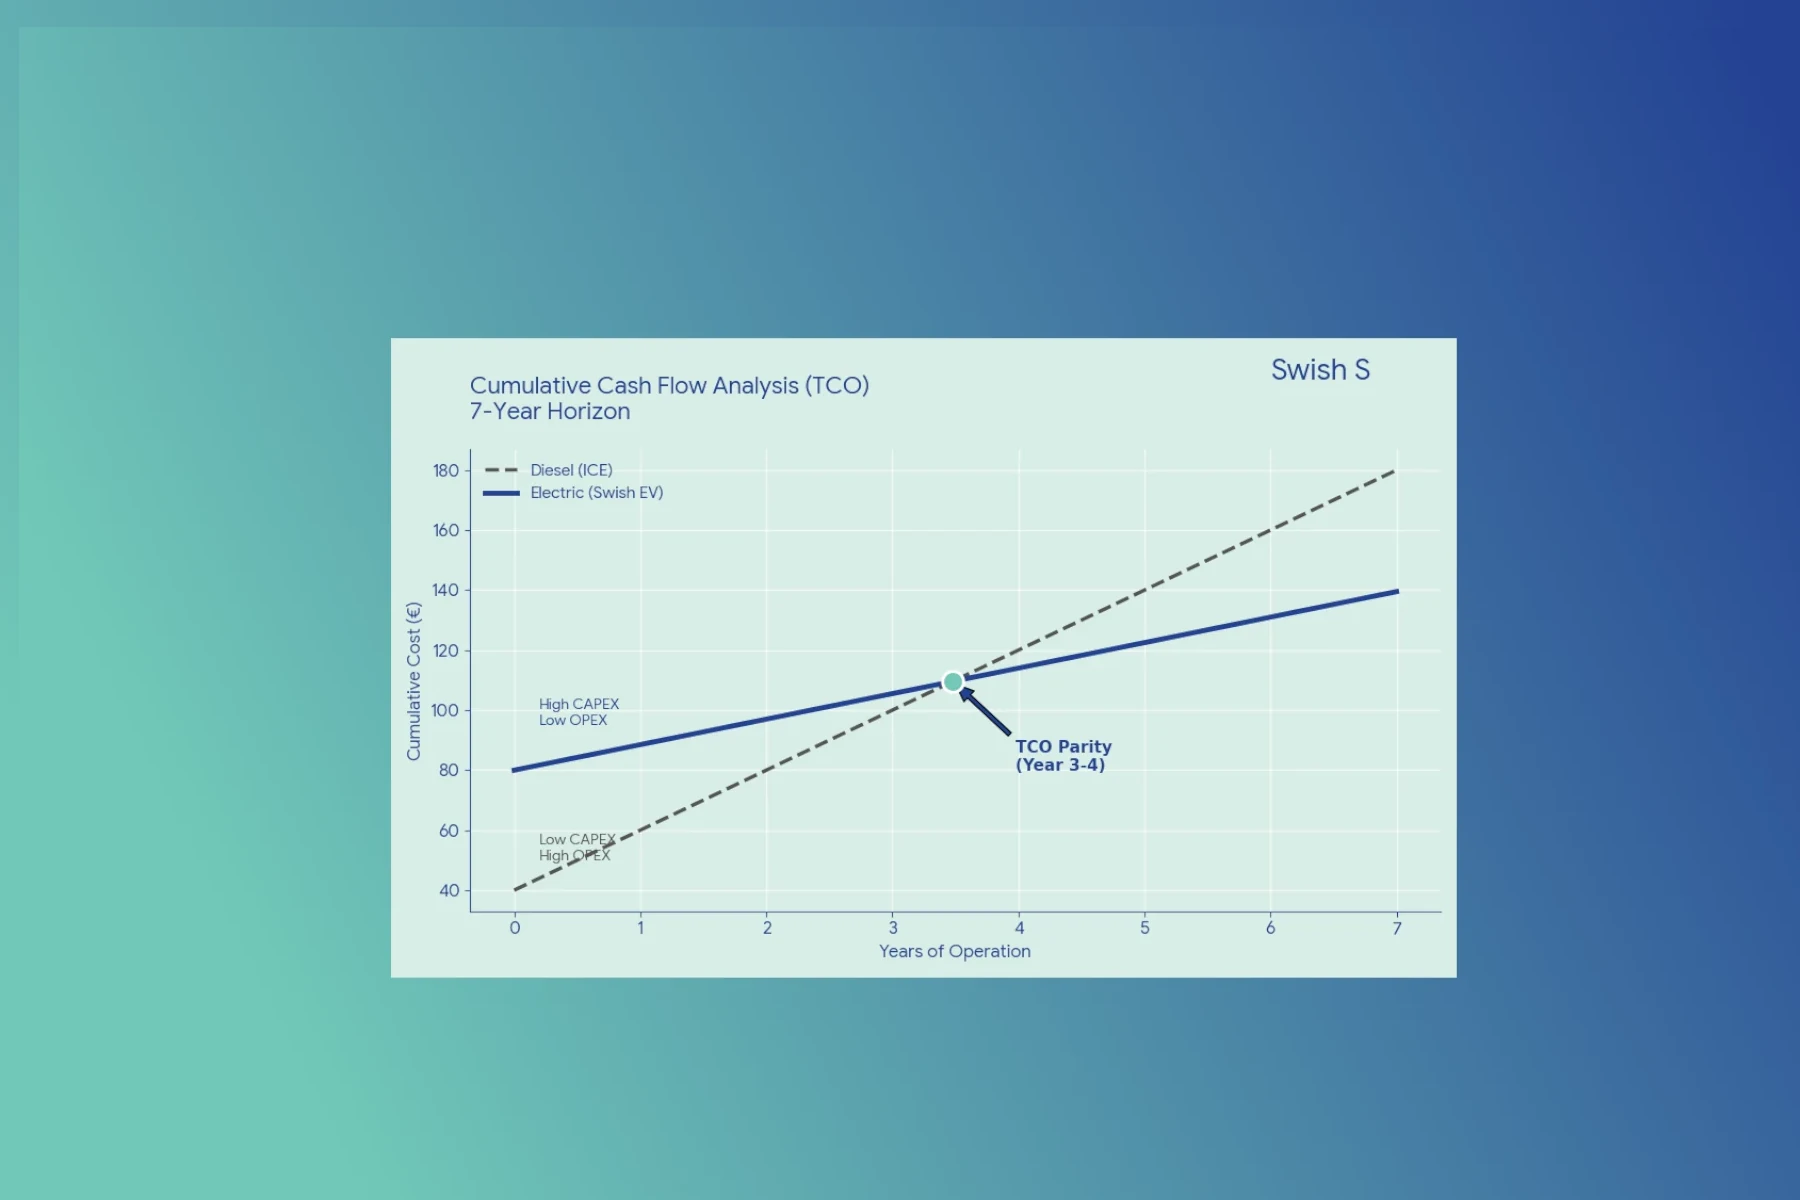
Cumulative Cash Flow & Break-Even Analysis
Diesel Risks in Europe: Regulatory Compliance and Residual Value
Financial planning for diesel fleets must now account for "uncontrollable external risks" that were previously negligible.
The "Business as Usual" scenario has become a high-risk strategy due to the introduction of regulatory and market friction.
The "Cost of Friction": Regulatory Impact
European regulations have introduced non-compliance costs that artificially inflate the TCO of ICE vehicles. This is no longer an environmental issue; it is a market access issue.
Access Restrictions
Low Emission Zones are creating a two-tier logistics market. Diesel vehicles face daily entry fees, restricted operating windows, or total bans. This introduces a "Cost of Friction"—the revenue lost when a vehicle cannot execute a delivery due to restrictions.
Asset Stranding (Residual Value Risk)
This is perhaps the most critical concern for the balance sheet. Diesel vehicles purchased today face accelerated depreciation curves. As urban access tightens, the secondary market for diesel delivery vehicles will collapse, potentially leaving fleets with "Stranded Assets" that hold book value but have zero liquidity.
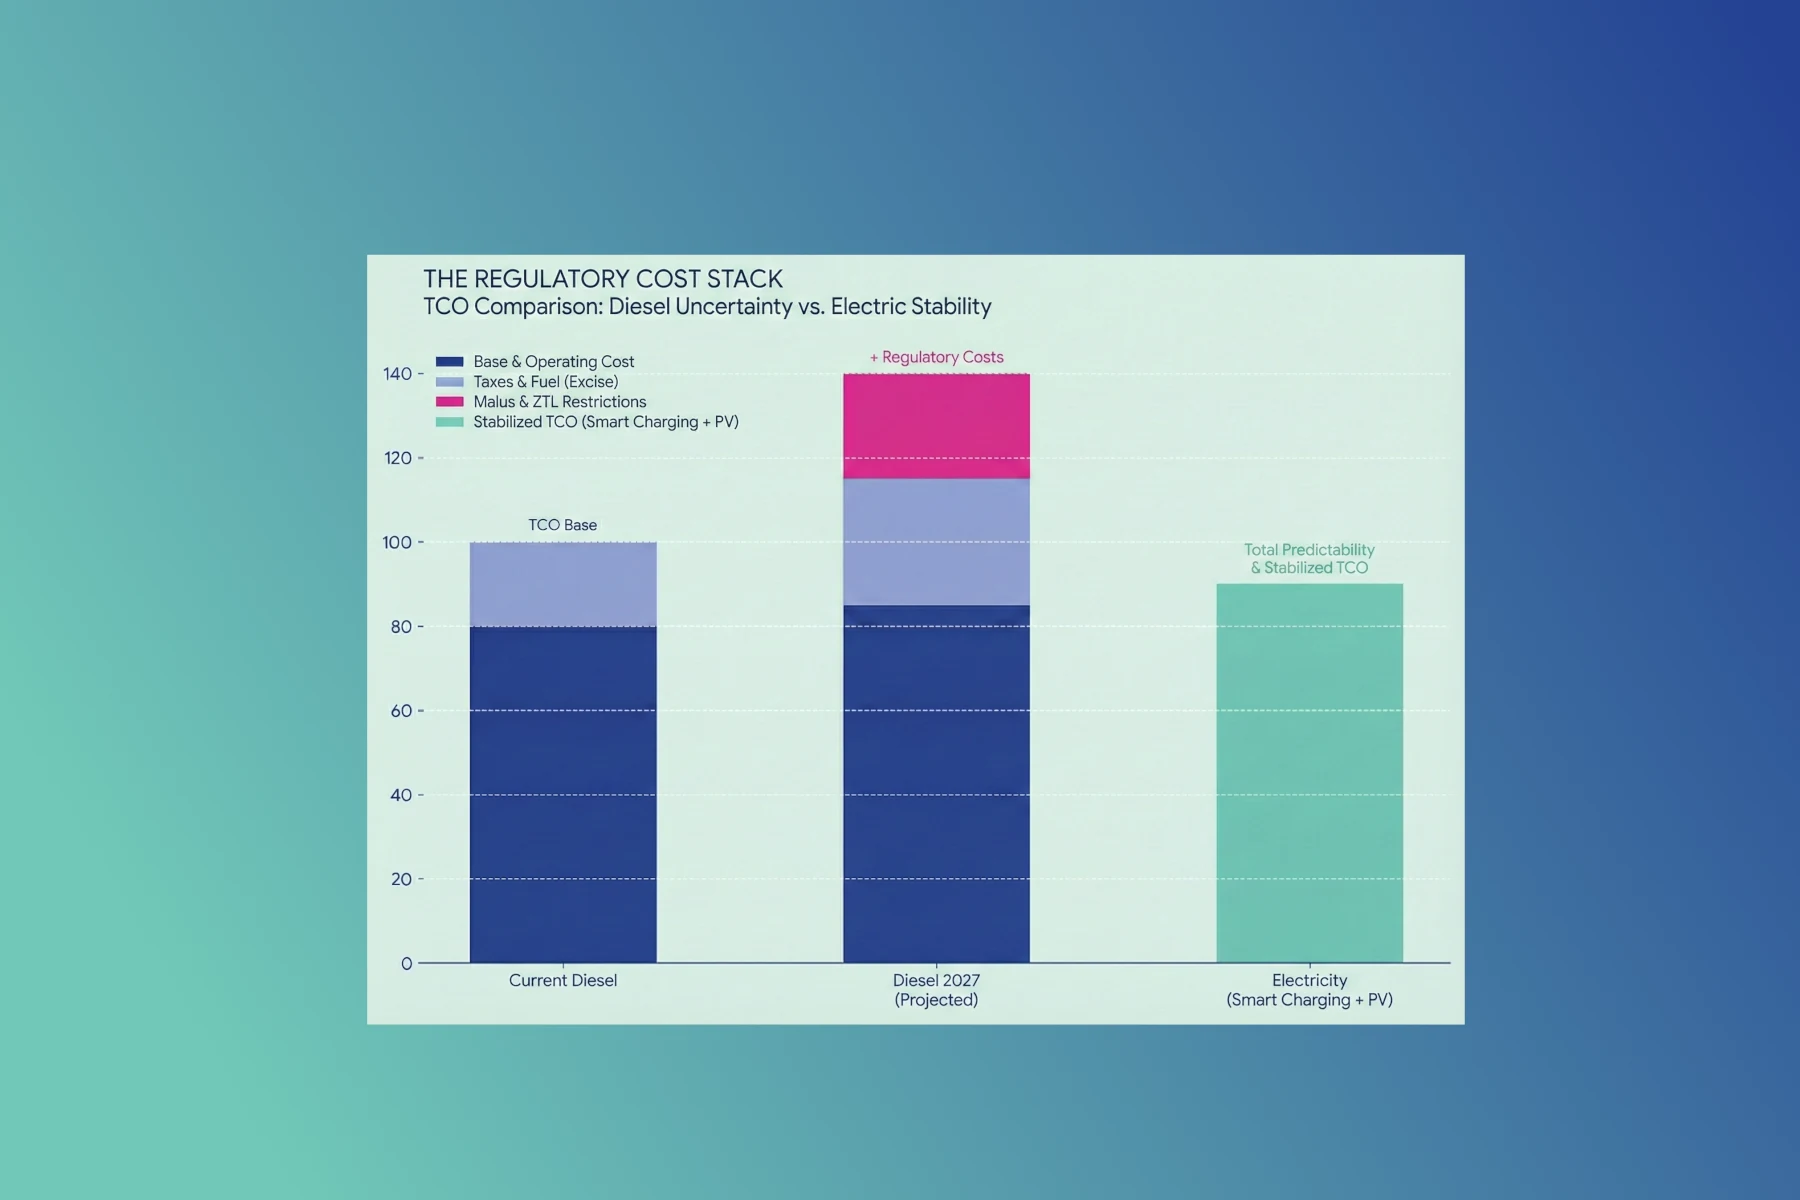
Energy Volatility vs. Price Stability
The Regulatory Cost Stack
Diesel prices remain exposed to geopolitical volatility and high taxation structures. A fleet manager cannot accurately forecast diesel costs 36 months out.
Conversely, electricity pricing offers a mechanism for cost stabilization. Through managed charging strategies (Smart Charging) and Power Purchase Agreements (PPAs), fleets can secure fixed pricing or leverage off-peak tariffs.
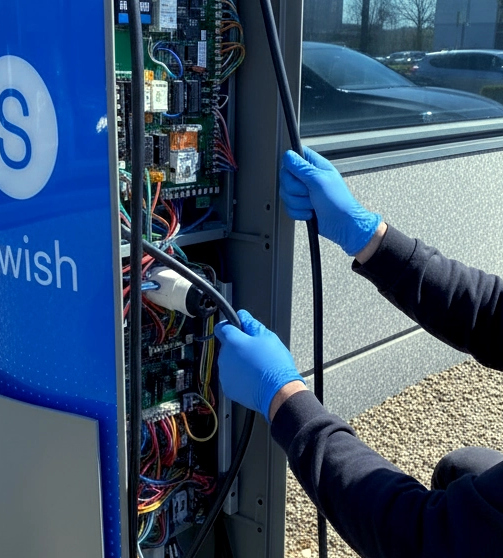
The Cost of Downtime: Why Charging Reliability is Critical
The viability of the electric TCO model is entirely contingent upon infrastructure reliability. A common error in early adoption is viewing the charger as a commodity hardware purchase. However, infrastructure failure introduces "Downtime Cost"—a multiplier effect that can instantly negate months of OpEx savings.
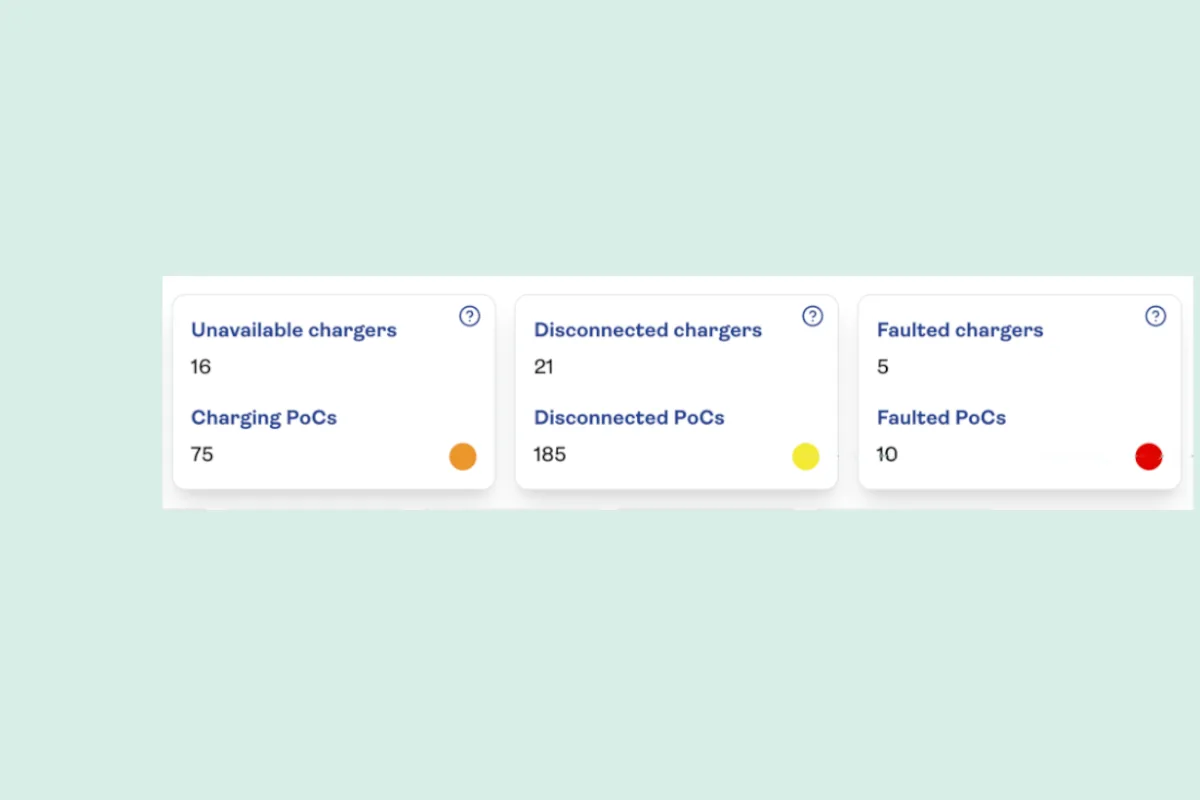
The Multiplier Effect of Failure
Revenue Loss
In professional logistics, a charger failure is not an inconvenience; it is a service failure.
Fixed Cost Leakage
Driver wages and vehicle leasing costs are paid despite zero productivity.
The 4x Repair Cost
Data indicates that corrective maintenance (emergency repairs) incurs costs up to 4 times higher than preventive maintenance contracts.
The CapEx Formula of Uptime
CapEx calculations
Infrastructure CapEx calculations must mathematically account for availability rates. Low-reliability hardware necessitates capital redundancy (purchasing excess chargers to cover failures).
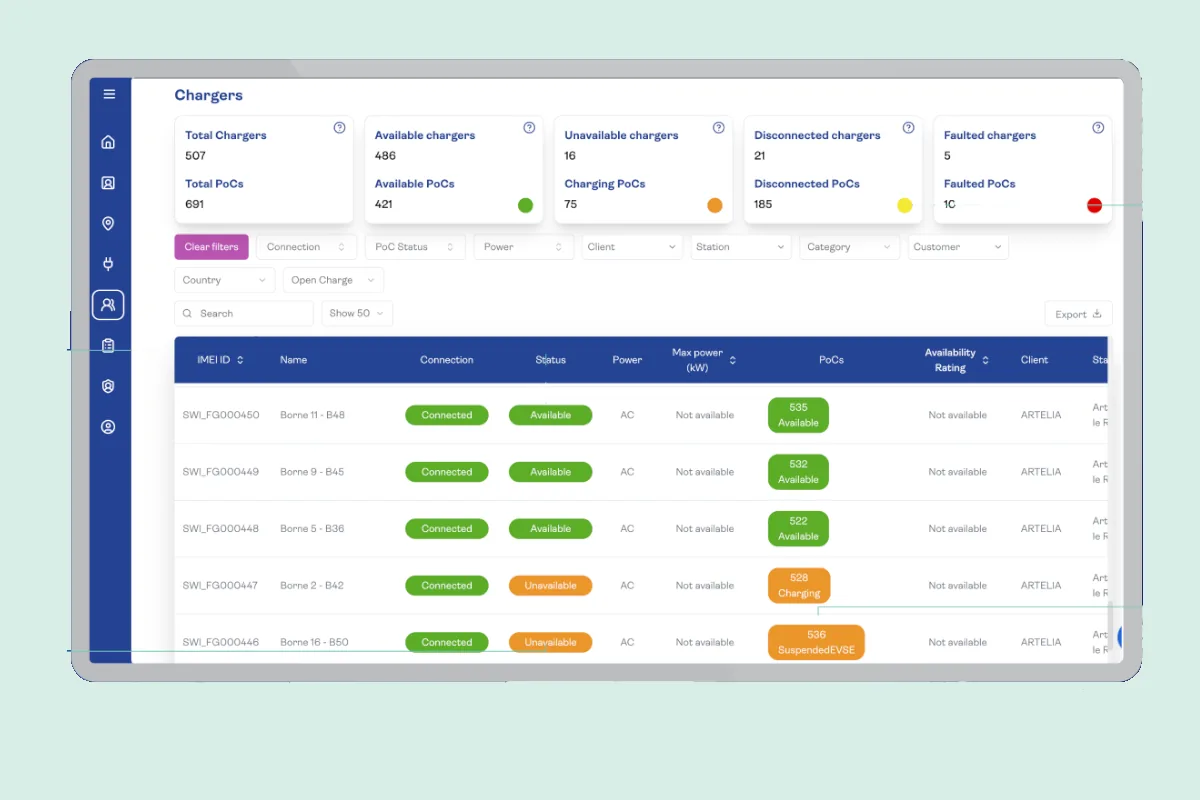
Availability Impact
ncreasing charger uptime from a standard market rate of 95% to the Swish standard of 99% effectively reduces the required capital investment multiplier from 1.05 to 1.01.

Financial Implication
Investing in premium, managed infrastructure reduces the total capital requirement by ~3.8%. Reliability is not a premium feature; it is a CapEx reduction strategy.
The Swish Technical Standard: Mitigating Risk
To eliminate operational risk, Swish implements a rigorous technical strategy designed for mission-critical fleets. We do not rely on proprietary "black boxes"; we integrate an open, robust ecosystem:

Hardware-Agnostic Excellence
We integrate only Tier-1 European technology partners such as Alpitronic and Kempower, renowned for their durability in heavy-duty cycles.
Certified Security & Quality
Our operations are governed under ISO 27001 (Information Security) and ISO 9001 (Quality Management) standards, ensuring your data and operations are audit ready.
Contractual Service Levels (SLA)
We back our technology with binding performance guarantees. Our GTI (Guaranteed Time of Intervention) metrics are tailored to fleet criticality—ranging from <5 minute telephone response for critical truck/bus segments to next-day on-site restoration.
Full Interoperability
Integration via OCPP 1.6J/2.0 and ISO 15118 ensures compatibility with your existing Fleet Management Software (FMS) and roaming platforms like Gireve and Hubject.
Transition Timing and ROI Acceleration
When does the switch make financial sense? Market analysis suggests that TCO parity is driven by vehicle segment, utilization intensity, and the strategic use of subsidies.
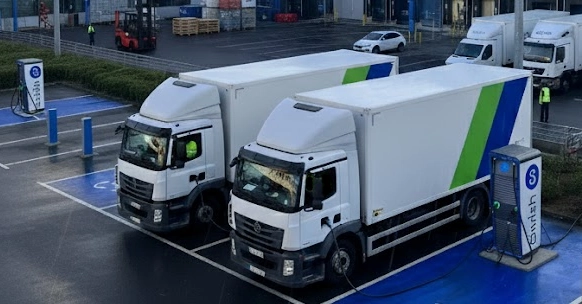
Heavy Duty
Without subsidies, parity is projected for 2027, but optimized energy procurement and smart depot charging can accelerate this timeline by 2-3 years.
.webp)
Urban Buses
With predictable routes and high annual mileage (+75,000 km), this segment leads the transition. The operational parity is driven by high energy efficiency in frequent-stop cycles.
.webp)
e-LCVs (Vans)
For last-mile logistics, TCO parity is often achieved within the first 36 months of ownership driven by maintenance deflation.
Corporate Fleets (Company Cars)
Profitability hinges on the "Charging Location Arbitrage." Prioritizing charging at workplace and home depots avoids the premium of public fast charging, accelerating ROI against ICE vehicles significantly.
From Generic Data to Specific Insight
Reliance on industry averages introduces an unacceptable margin of error for professional fleets. A precise TCO calculation requires the modelling of your specific route of energy consumption, your local tariff structures, and your fleet duty cycles.
Do not guess. Calculate.
Request a Feasibility & TCO Audit
Request a Feasibility & TCO Audit.
Maximize Operational Savings (OpEx) Turn diesel volatility into predictable costs. We design charging scenarios that leverage energy arbitrage (€0.11/km) and a 30% reduction in maintenance to recover margins from day one.
Eliminate the "Cost of Downtime"
Protect your ROI by avoiding unplanned outages. Our certified technology and SLAs guarantee over 99% uptime, ensuring your vehicles charge every night without incurring losses from service failures.
Capitalize on Incentives and Mitigate Risks
Seize the grants and subsides' window to offset initial CapEx and secure the future value of your assets against low emission zones restrictions and the accelerated depreciation of diesel fleets.